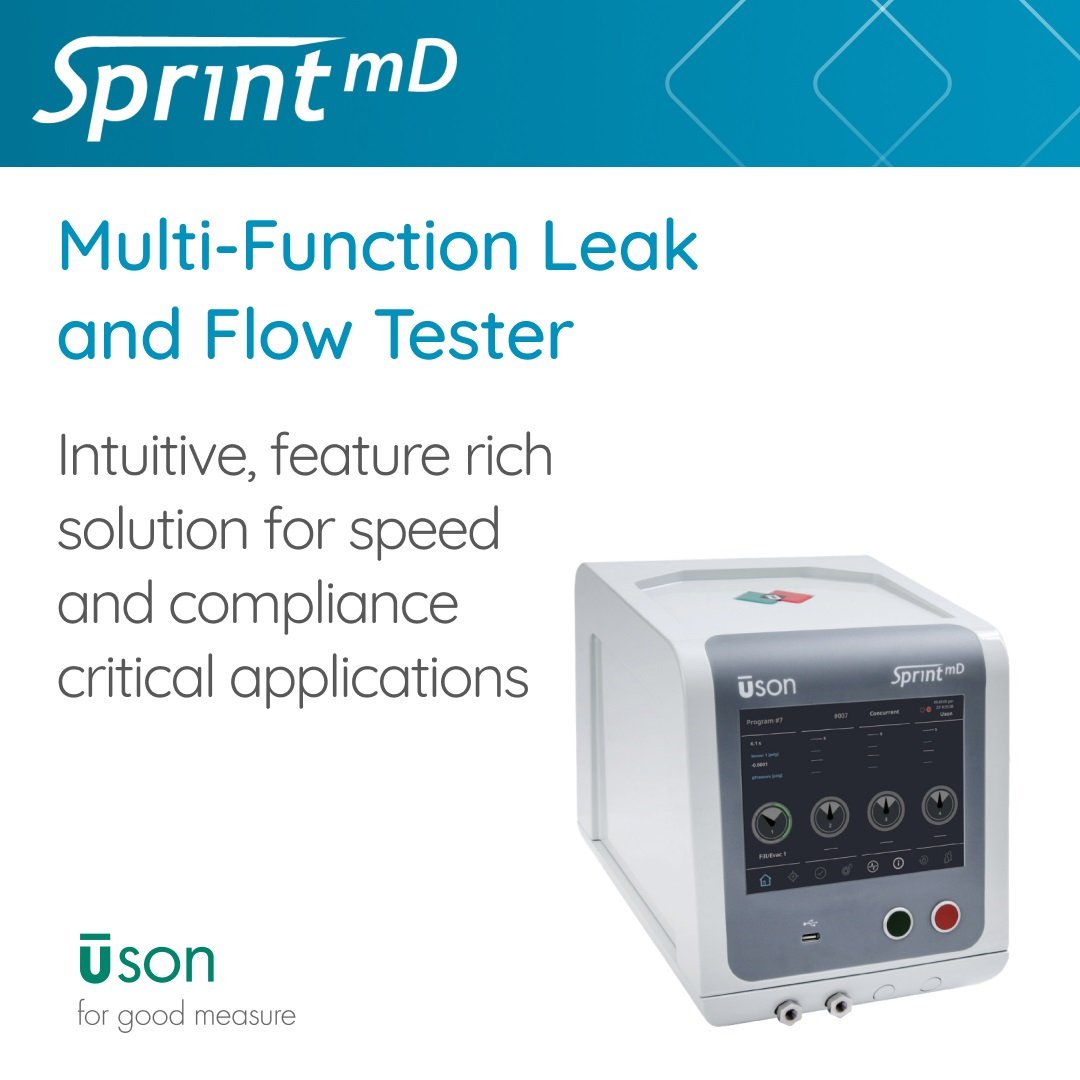
Accuracy and insight are essential for leak testing for lead testing medical devices like catheters. The Sprint mD leak tester’s pressure profile graph offers a detailed visual representation of pressure changes during a leak test, providing several key benefits.

First, it helps in identifying anomalies. By observing the graph, users can quickly spot irregularities or unexpected pressure changes that may indicate issues such as leaks, blockages, or equipment malfunctions. Additionally, the graph enhances accuracy. Both real-time and historical data allow for more precise analysis and troubleshooting, resulting in more accurate test outcomes. Lastly, the pressure profile graph improves efficiency by helping users understand the pressure behavior, which allows for optimizing the test cycle, reducing downtime, and increasing throughput.
What is a Pressure Profile Graph?
A pressure profile graph shows the pressure behavior during each stage of a leak test—filling, stabilization, and testing—allowing users to quickly identify anomalies. The Sprint mD’s real-time and historical graph data enhances testing accuracy and efficiency by providing deeper insights into test results.
A pressure profile graph displays the pressure behavior throughout each phase of a leak test, which typically includes:
- Filling Phase: This is when the test object is filled with a gas or liquid to a specified pressure.
- Stabilization Phase: The pressure is held steady to allow the system to stabilize and any initial fluctuations to settle.
- Testing Phase: The actual leak test is conducted, and the pressure is monitored to detect any drops that would indicate a leak.
Key Use Cases for Troubleshooting
- Leak Detection: A sudden drop in pressure during stabilization indicates potential leaks, allowing operators to identify and address issues early in the process.
- Blockage Detection: Slow pressure rise or unusual plateaus reveal blockages or restricted flow, helping avoid performance issues in products like valves or fuel injectors.
- Valve Performance: Delayed or inconsistent pressure control on the graph may indicate valve malfunctions, crucial for fast-filling systems like appliances and transmissions.
- Test Stability: Variations in the pressure curve between tests can indicate problems with seals, parameters, or environmental conditions, ensuring test repeatability and reliability.
- Cycle Time Optimization: Monitoring the pressure profile helps identify inefficiencies, such as extended filling phases, enabling faster test cycles and increased throughput.
Enhanced Leak Testing for Optimized Production
The pressure profile graph on the Sprint mD enhances leak testing by offering real-time, actionable insights that improve troubleshooting, reduce downtime, and optimize production. It’s a powerful tool for manufacturers seeking precision, efficiency, and quality control in industries like automotive, medical devices, and industrial manufacturing.
Contact us for more information or to schedule a demo
If you need immediate assistance with an application or project or would like to learn more about optimizing your production processes with leak testing, don’t hesitate to reach out to our team. Contact us directly at sales@uson.com or connect with your local PAC representative.
 English
 简体中文
简体中文
 Deutsch
 Español


